PixelLib Library is a library created to allow easy integration of object segmentation in images and videos using few lines of python code. PixelLib now provides support for PyTorch backend to perform faster, more accurate segmentation and extraction of objects in images and videos using PointRend segmentation architecture
Demand for Real Time Image Segmentation Applications
Image segmentation is an aspect of computer vision that deals with segmenting the contents of objects visualized by a computer into different categories for better analysis. The contributions of image segmentation in solving a lot of computer vision problems such as analysis of medical images, background editing, vision in self driving cars and analysis of satellite images make it an invaluable field in computer vision. One of the greatest challenges in computer vision is keeping the space between accuracy and speed performance for real time applications. In the field of computer vision there is this dilemma of a computer vision solution either being more accurate and slow or less accurate and faster.
PixelLib Library is a library created to allow easy integration of object segmentation in images and videos using few lines of python code. The previous version of PixelLib uses Tensorflow deep learning as its backend which employs Mask R-CNN to perform instance segmentation. Mask R-CNN is a great object segmentation architecture, but it fails to balance between the accuracy and speed performance for real time applications. PixelLib provides support for PyTorch backend to perform faster, more accurate segmentation and extraction of objects in images and videos using PointRend segmentation architecture.
PointRend by Alexander Kirillov et al is used to replace Mask R-CNN for performing instance segmentation of objects. PointRend is an excellent state of the art neural network for implementing object segmentation. It generates accurate segmentation masks and run at high inference speed that matches the increasing demand for an accurate and real time computer vision applications. I integrated PixelLib with the python implementation of PointRend by Detectron2 which supports only Linux OS. I made modifications to the original Detectron2 PointRend implementation to support Windows OS. PointRend implementation used for PixelLib supports both Linux and Windows OS.
Note: This article is based on performing instance segmentation using PyTorch and PointRend. If you want to learn how to perform instance segmentation with Tensorflow and Mask R-CNN read this article.
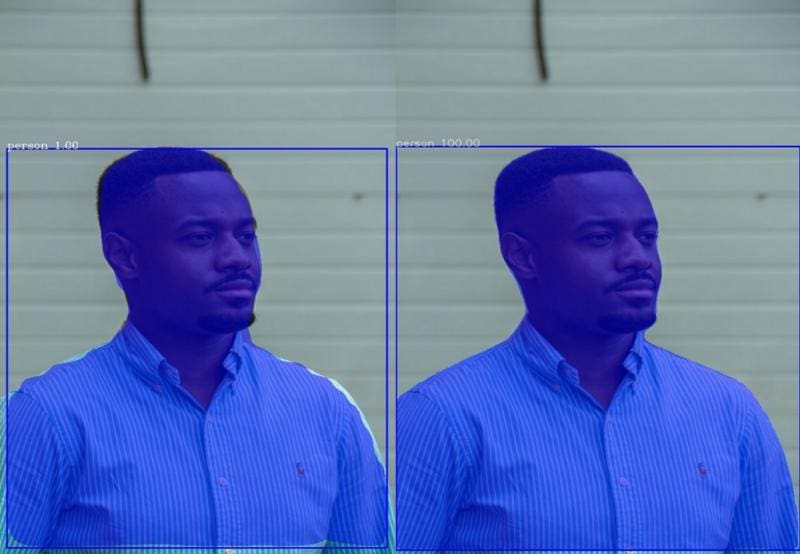
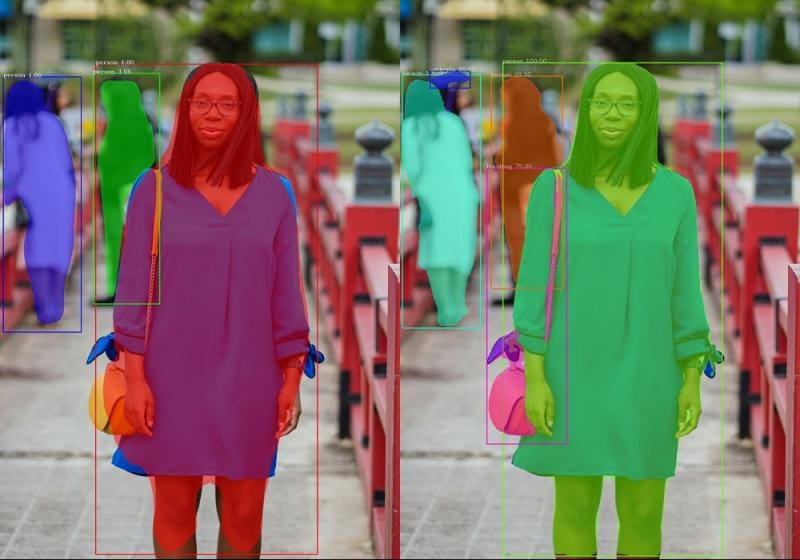
Original Image Source (left:MASK R-CNN, right:PointRend)
Original Image Source (left:MASK R-CNN, right:PointRend)
The images labelled PointRend are obviously better segmentation results than Mask R-CNN.
Download & Installation
Download Python
PixelLib PyTorch supports python version 3.7 and above. Download a compatible python version.
Install PixelLib and its dependencies
Install PyTorch
PixelLib PyTorch version supports these versions of PyTorch(1.6.0,1.7.1,1.8.0 and 1.90). PyTorch 1.7.0 is not supported and do not use any PyTorch version less than 1.6.0. Install a compatible PyTorch version.
Install Pycocotools
pip3 install pycocotools
Install PixelLib
pip3 install pixellib
If installed, upgrade to the latest version using:
pip3 install pixellib -upgrade
Image Segmentation
PixelLib uses five lines of python code for performing object segmentation in images and videos with PointRend model. Download the PointRend model. This is the code for image segmentation.
import pixellib
from pixellib.torchbackend.instance import instanceSegmentation

ins = instanceSegmentation()
ins.load_model("pointrend_resnet50.pkl")
ins.segmentImage("image.jpg", show_bboxes=True, output_image_name="output_image.jpg")
Line 1-4: PixelLib package was imported and we also imported the class instanceSegmentation from the module pixellib.torchbackend.instance (importing instance segmentation class from PyTorch support). We created an instance of the class and finally loaded the PointRend model we have downloaded.
Line 5: We called the function segmentImage to perform segmentation of objects in images and added the following parameters to the function:
- Image_path: This is the path to the image to be segmented.
- Show_bbox: This is an optional parameter to show the segmented results with bounding boxes.
- Output_image_name: This is the name of the saved segmented image.
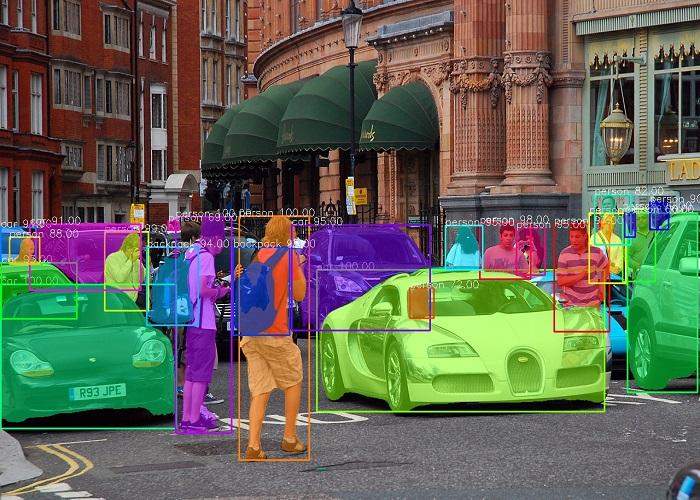
Sample Image for Segmentation
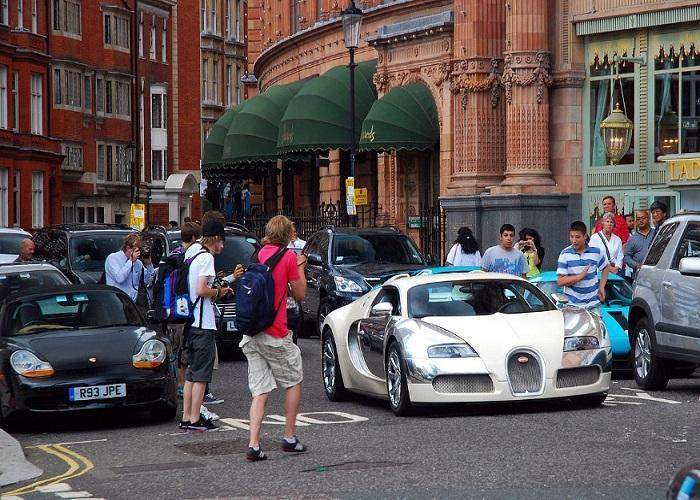
Original Image Source
ins.segmentImage("image.jpg", show_bboxes = True, output_image_name="output.jpg")Image After Segmentation
The checkpoint state_dict contains keys that are not used by the model:
proposal_generator.anchor_generator.cell_anchors.{0, 1, 2, 3, 4}
This log above may appear if you are running the segmentation code. It is not an error and the code will work fine.
results, output = ins.segmentImage("image.jpg", show_bboxes=True, output_image_name="result.jpg")
print(results)
The segmentation results return a dictionary with values associated with the objects segmented in the image. The results printed will be in the following format:
{'boxes':  array([[ 579,  462, 1105,  704],
       [   1,  486,  321,  734],
       [ 321,  371,  423,  742],
       [ 436,  369,  565,  788],
       [ 191,  397,  270,  532],
       [1138,  357, 1197,  482],
       [ 877,  382,  969,  477],),
'class_ids': array([ 2,  2,  0,  0,  0,  0,  0,  2,  0,  0,  0,  0,  2, 24, 24,2,  2,2,  0,  0,  0,  0,  0,  0], dtype=int64),
'class_names': ['car', 'car', 'person', 'person', 'person', 'person', 'person', 'car', 'person', 'person', 'person', 'person', 'car', 'backpack', 'backpack', 'car', 'car', 'car', 'person', 'person', 'person', 'person', 'person', 'person'],
 'object_counts': Counter({'person': 15, 'car': 7, 'backpack': 2}),
'scores': array([100., 100., 100., 100.,  99.,  99.,  98.,  98.,  97.,  96.,  95.,95.,  95.,  95.,  94.,  94.,  93.,  91.,  90.,  88.,  82.,  72.,69.,  66.], dtype=float32),
'masks': array([[[False, False, False, ..., False, False, False],
[False, False, False, ..., False, False, False],
'extracted_objects': []
Detection Threshold
PixelLib makes it possible to determine the detection threshold of object segmentation.
ins.load_model("pointrend_resnet50.pkl", confidence = 0.3)confidence: This is a new parameter introduced in the load_model function and it is set to 0.3 to threshold the detections by 30%. The default value I set for detection threshold is 0.5 and it can be increased or decreased using the confidence parameter.
Speed Records
PixelLib makes it possible to perform real time object segmentation and added the ability to adjust the inference speed to suit real time predictions. The default inference speed for processing a single image using Nvidia GPU with 4GB capacity is about 0.26 seconds.
Speed Adjustments
PixelLib supports speed adjustments and there are two types of speed adjustment modes which are fast and rapid modes:
1. Fast Mode
ins.load_model("pointrend_resnet50.pkl", detection_speed = "fast")In the load_model function, we added the parameter detection_speed and set the value to fast. The fast mode achieves 0.20 seconds for processing a single image.
Full Code for Fast Mode Detection
import pixellib
from pixellib.torchbackend.instance import instanceSegmentation

ins = instanceSegmentation()
ins.load_model("pointrend_resnet50.pkl", detection_speed = "fast")
ins.segmentImage("image.jpg", show_bboxes=True, output_image_name="output_image.jpg")
2. Rapid Mode
ins.load_model("pointrend_resnet50.pkl", detection_speed = "rapid")In the load_model function, we added the parameter detection_speed and set the value to rapid. The rapid mode achieves 0.15 seconds for processing a single image.
Full Code for Rapid Mode Detection
import pixellib
from pixellib.torchbackend.instance import instanceSegmentation

ins = instanceSegmentation()
ins.load_model("pointrend_resnet50.pkl", detection_speed = "rapid")
ins.segmentImage("image.jpg", show_bboxes=True, output_image_name="output_image.jpg")
PointRend Models
There are two types of PointRend models used for object segmentation and they are of resnet50 variant and resnet101 variant. The resnet50 variant is used throughout this article because it is faster and of good accuracy. The resnet101 variant is more accurate but it is slower than resnet50 variant. According to the official reports of the models on Detectron2 the resnet50 variant achieves 38.3 mAP on COCO and resnet101 variant achieves 40.1 mAP on COCO.
Speed Records for Resnet101: The default speed for segmentation is 0.5 seconds, fast mode is 0.3 seconds while the rapid mode is 0.25 seconds.
Code for Resnet101 variant
import pixellib
from pixellib.torchbackend.instance import instanceSegmentation

ins = instanceSegmentation()
ins.load_model("pointrend_resnet101.pkl", network_backbone="resnet101")
ins.segmentImage("sample.jpg",  show_bboxes = True, output_image_name="output.jpg")
The code for performing inference with the resnet101 model is the same, except we loaded the PointRend resnet101 model in the load_model function. Download the resnet101 model from here. We added an extra parameter network_backbone in the load_model function and set the value to resnet101.
Note: If you want to achieve high inference speed and good accuracy, use PointRend resnet50 variant, but if you are more concerned about accuracy, use the PointRend resnet101 variant. All these inference reports are based on using Nvidia GPU with 4GB capacity.
Custom Object Detection in Image Segmentation
The PointRend model used is a pretrained COCO model which supports 80 classes of objects. PixelLib supports custom object detection which makes it possible to filter detections and ensure segmentation of target objects. We can choose out of the 80 classes of objects supported to match our target goal. These are the 80 classes of objects supported:
person, bicycle, car, motorcycle, airplane,
bus, train, truck, boat, traffic_light, fire_hydrant, stop_sign,
parking_meter, bench, bird, cat, dog, horse, sheep, cow, elephant, bear, zebra,
giraffe, backpack, umbrella, handbag, tie, suitcase, frisbee, skis, snowboard,
sports_ball, kite, baseball_bat, baseball_glove, skateboard, surfboard, tennis_racket,
bottle, wine_glass, cup, fork, knife, spoon, bowl, banana, apple, sandwich, orange,
broccoli, carrot, hot_dog, pizza, donut, cake, chair, couch, potted_plant, bed,
dining_table, toilet, tv, laptop, mouse, remote, keyboard, cell_phone, microwave,
oven, toaster, sink, refrigerator, book, clock, vase, scissors, teddy_bear, hair_dryer,
toothbrush.
Code for Segmentation of Target Classes
import pixellib
from pixellib.torchbackend.instance import instanceSegmentation
ins = instanceSegmentation()
ins.load_model("pointrend_resnet50.pkl")
target_classes = ins.select_target_classes(person = True)
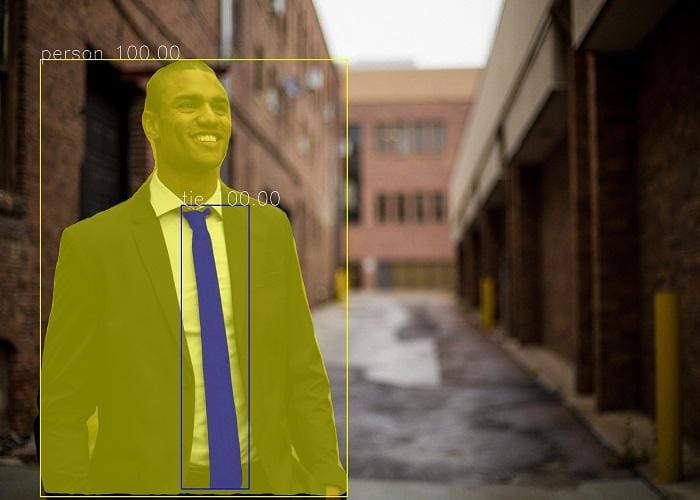
ins.segmentImage("image.jpg", show_bboxes=True, segment_target_classes = target_classes, output_image_name="output_image.jpg")The function select_target_classes was called to select the target objects to be segmented. The function segmentImage got a new parameter segment_target_classes to choose from the target classes and filter the detections based on them. We filter the detections to detect only person in the image.
Object Extractions in Images
PixelLib makes it possible to extract and analyse objects segmented in an image.
Code for Object Extraction
import pixellib
from pixellib.torchbackend.instance import instanceSegmentation

ins = instanceSegmentation()
ins.load_model("pointrend_resnet50.pkl")
ins.segmentImage("image.jpg", show_bboxes=True, extract_segmented_objects=True,
save_extracted_objects=True, output_image_name="output_image.jpg" )
The code for image segmentation is the same, except we added extra parameters extract_segmented_objects and save_extracted_objects to extract segmented object and save the extracted objects respectively. Each of the segmented objects will be saved as segmented_object_index e.g segmented_object_1. The objects are saved based in the order in which they are extracted.
segmented_object_1.jpg
segmented_object_2.jpg
segmented_object_3.jpg
segmented_object_4.jpg
segmented_object_5.jpg
segmented_object_6.jpg
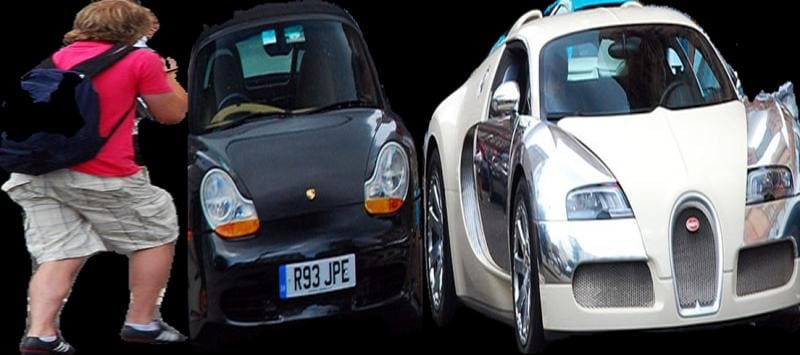
Note: All the objects in the image are extracted and I chose to display only three of them.
Extraction of Object from Bounding Box Coordinates
import pixellib
from pixellib.torchbackend.instance import instanceSegmentation

ins = instanceSegmentation()
ins.load_model("pointrend_resnet50.pkl")
ins.segmentImage("image.jpg", show_bboxes=True, extract_segmented_objects=True, extract_from_box = True,
save_extracted_objects=True, output_image_name="output_image.jpg" )
We introduced a new parameter extract_from_box to extract the objects segmented from their bounding boxes coordinates. Each of the extracted objects will be saved as object_extract_index e.g object_extract_1. The objects are saved in the order in which they are extracted.
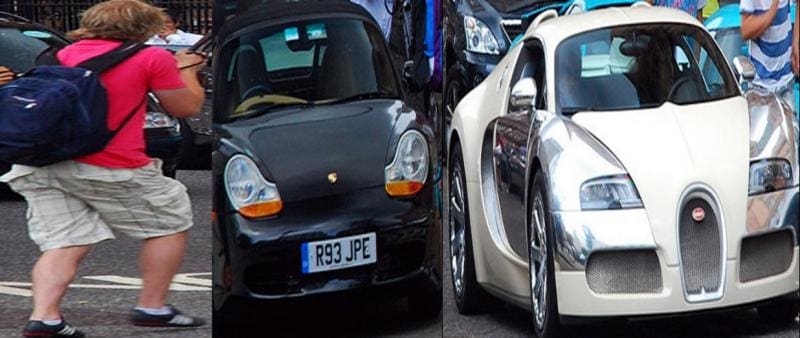
Extracts from Bounding Box Coordinates
Image Segmentation Output Visualization
PixelLib makes it possible to regulate the visualization of images according to their resolutions.
ins.segmentImage("sample.jpg", show_bboxes=True, output_image_name= "output.jpg")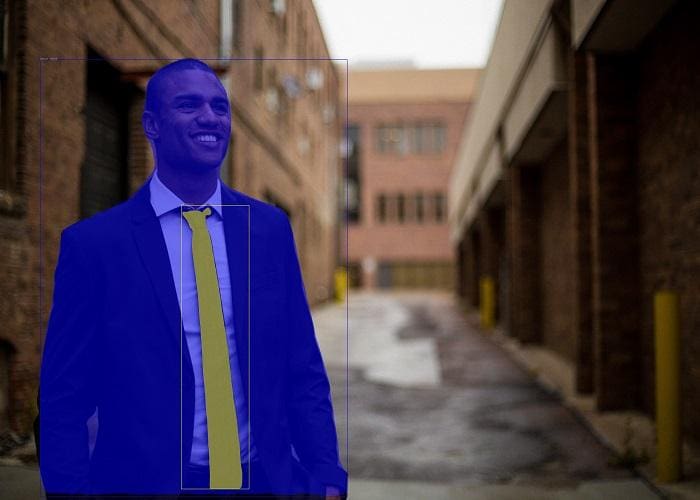
Original Image Source
The visualization wasn’t visible because the text size, and box thickness are too slim. We can regulate the text size, text thickness, and box thickness to regulate the visualizations.
Modifications for Better Visualization.
ins.segmentImage(“sample.jpg”, show_bboxes=True, text_size=5, text_thickness=4, box_thickness=10, output_image_name=”output.jpg”)
The segmentImage function accepted new parameters that regulate the thickness of texts and bounding boxes.
- text_size: The default text size is 0.6 and it is okay with images with moderate resolutions. It will be too samll for images with high resolutions. I increased it to 5.
- text_thickness: The default text thickness is 1. I increased it to 4 to match the image resolution.
- box_thickness: The default box thickness is 2 and I changed it to 10 to match the image resolution.
Output Image with A Better Visualization
Note: Regulate the parameters according to the resolutions of your images. The values I used for this sample image whose resolution is 5760 x 3840 might be too large if your image resolution is lower. You can increase the values of the parameters beyond the ones I set in this sample code if you have images whose resolutions are very high. text_thickness and box_thickness parameters’ values must be in integers and do not express their values in floating point numbers. text_size value can be expressed in both integers and floating point numbers.
We discussed in detail in this article how to perform accurate and fast image segmentation and extraction of objects in images. We also described the upgrade added to PixelLib using PointRend that makes it possible for the library to match the increasing demand to balance between accuracy and speed performance in computer vision.
Note: Read the full tutorial that includes how to perform object segmentation on a batch of images, videos and live camera feeds using PixelLib.
Bio: Ayoola Olafenwa is a self-taught programmer, technical writer, and a deep learning practitioner. Ayoola has developed two open source computer vision projects that are used by many developers across the globe, and presently works as a Machine Learning Engineer at DeepQuest AI building and deploying machine learning applications in the cloud. Ayoola's areas of expertise are in computer vision and machine learning. She has experience working on machine learning systems, using deep learning libraries like PyTorch and Tensorflow to build and deploy machine learning models in production on cloud computing platforms like Azure using DevOp tools such as Docker, Pulumi and Kubernetes. Ayoola also works on deploying machine learning models on edge devices like Nvidia Jetson Nano and Raspberry PI devices using efficient frameworks like PyTorchMobile, TensorflowLite and ONNX Runtime.