Introduction:
Artificial Intelligence (AI) is a rapidly growing field that has revolutionized many industries, including Geographic Information Systems (GIS). AI has been integrated with GIS to improve data analysis, accuracy, and speed of processing. This report discusses the use of AI in GIS and its applications.
Background:
GIS is a powerful tool for analyzing geospatial data, which is widely used in various fields such as environmental management, urban planning, and natural resource management. GIS involves collecting, managing, analyzing, and displaying spatial data. However, traditional GIS methods have limitations in handling large and complex datasets, which can be time-consuming and prone to errors. This is where AI comes into play.
Use of AI in GIS:
AI has revolutionized GIS by enabling the processing of large and complex datasets in real-time. AI techniques such as machine learning, deep learning, and neural networks have been applied in GIS to analyze geospatial data. AI algorithms can process data from multiple sources such as satellite imagery, LiDAR data, and drone data to produce accurate and reliable results.
One of the major applications of AI in GIS is image classification. Image classification is the process of identifying and categorizing objects or features in an image. AI algorithms such as convolutional neural networks (CNNs) have been used for image classification in GIS. CNNs can analyze large datasets and identify patterns in the data, making them ideal for classifying land use/cover, vegetation, and water bodies from satellite imagery.
Another application of AI in GIS is object detection. Object detection is the process of identifying and locating objects in an image or video. AI algorithms such as YOLO (You Only Look Once) and Faster R-CNN (Region-based Convolutional Neural Networks) have been used for object detection in GIS. These algorithms can detect and locate objects such as buildings, roads, and vehicles from satellite imagery and LiDAR data.
AI has also been used in GIS for predictive modeling. Predictive modeling involves using statistical and machine learning techniques to predict future events or behaviors. AI algorithms such as random forest, decision trees, and neural networks have been used for predictive modeling in GIS. These algorithms can predict future land use/cover changes, forest fires, and flooding events.
Conclusion:
The integration of AI with GIS has improved the accuracy, speed, and reliability of geospatial data analysis. AI algorithms such as machine learning, deep learning, and neural networks have been used in GIS for image classification, object detection, and predictive modeling. The use of AI in GIS has numerous applications in fields such as environmental management, urban planning, and natural resource management. Further research and development in this area are needed to fully exploit the potential of AI in GIS.
Introduction:
Geographic Information Systems (GIS) is a powerful tool that allows for the collection, management, and analysis of spatial data. GIS is being used across a wide range of industries and sectors, including but not limited to: agriculture, environmental management, urban planning, and transportation. The aim of this report is to explore the use of GIS, its applications, and its advantages in different fields.
Literature Review:
GIS has been widely used in many fields and its applications are constantly expanding. For example, GIS has been used in agriculture to help farmers manage their crops more efficiently. A study by Tanya Haddad and colleagues (2020) demonstrated the use of GIS in precision farming, which includes soil analysis, nutrient management, and crop health analysis. GIS is also used in environmental management, specifically for natural resource management, such as forest management, wildlife conservation, and water management. A study by Kariuki and colleagues (2019) showed the use of GIS in analyzing the spatiotemporal patterns of deforestation and land use changes in the Mau Forest Complex in Kenya. GIS is also used in urban planning, specifically for land-use planning, infrastructure management, and disaster risk reduction. A study by Wang and colleagues (2020) demonstrated the use of GIS in assessing the flood risk in urban areas. Lastly, GIS is used in transportation planning, such as traffic analysis, route planning, and public transportation management. A study by Griswold and colleagues (2019) showed the use of GIS in analyzing the accessibility of public transportation in urban areas.
Use Cases:
One of the most popular use cases of GIS is for mapping and visualization. GIS allows for the creation of maps that can display data in a visually compelling way, providing insights that are not easily visible in tabular or textual form. For example, GIS can be used to create a heat map that shows the density of a certain population in a specific area. Another popular use case of GIS is for spatial analysis. GIS allows for the manipulation of spatial data, allowing for complex queries and analysis. For example, GIS can be used to analyze the relationship between the location of a certain facility and the demographics of the surrounding area. Another use case of GIS is for decision-making. GIS allows for the integration of different types of data, which can help decision-makers make informed decisions. For example, GIS can be used to analyze the impact of a certain policy on a specific area.
Advantages:
The advantages of GIS are numerous. One of the main advantages of GIS is its ability to handle and analyze large amounts of spatial data. GIS allows for the integration of different types of data, such as satellite imagery, census data, and environmental data, which can help analysts make more informed decisions. Another advantage of GIS is its ability to visualize data in a way that is easy to understand. GIS can create maps and other visualizations that help users understand complex data in a more intuitive way. Additionally, GIS can help improve efficiency in decision-making. GIS can help users identify patterns and relationships in data that may not be immediately visible, allowing for more informed decisions.
Conclusion:
In conclusion, GIS is a powerful tool that is being used across a wide range of fields. GIS has many advantages, including its ability to handle and analyze large amounts of spatial data, visualize data in a way that is easy to understand, and improve efficiency in decision-making. The use cases for GIS are constantly expanding, and it is expected that GIS will continue to play a critical role in many industries and sectors in the future.
References:
Griswold, J., Kaminsky, J., & Jiao, R. (2019). Evaluating the Accessibility of Public Transportation in Urban Areas Using GIS. Transportation Research Record, 036119811988
We will use the geo-database configured in the previous tutorial, fill one of its table with world cities geocoordinates, and show these cities eventually on a map in the Django web app that will be configured in this tutorial.
Create a new Django project
Install Django (v2 is the latest version) using the Python package manager pip:
Another python package that must be installed is the PostgreSQL adapter for python, Psycopg:
For the purpose of this tutorial, we’ll go briefly through the steps necessary to create a new Django project with a single app. A more comprehensive tutorial dedicated to creating a poll application with Django can be found on the official website, and constitutes a good starting point to get started with Django.
Create a new directory and generate a new project inside of it. Let’s call our project “world”:
Afterwards, we need to configure Django to have access to the database we created using the user added in the first part of this tutorial. To do so, in your project folder open the file ‘world/settings.py` and add the following (don’t forget to set the database name and the user/password accordingly):
If the database has been configured correctly, you can now run the server from the command-line:
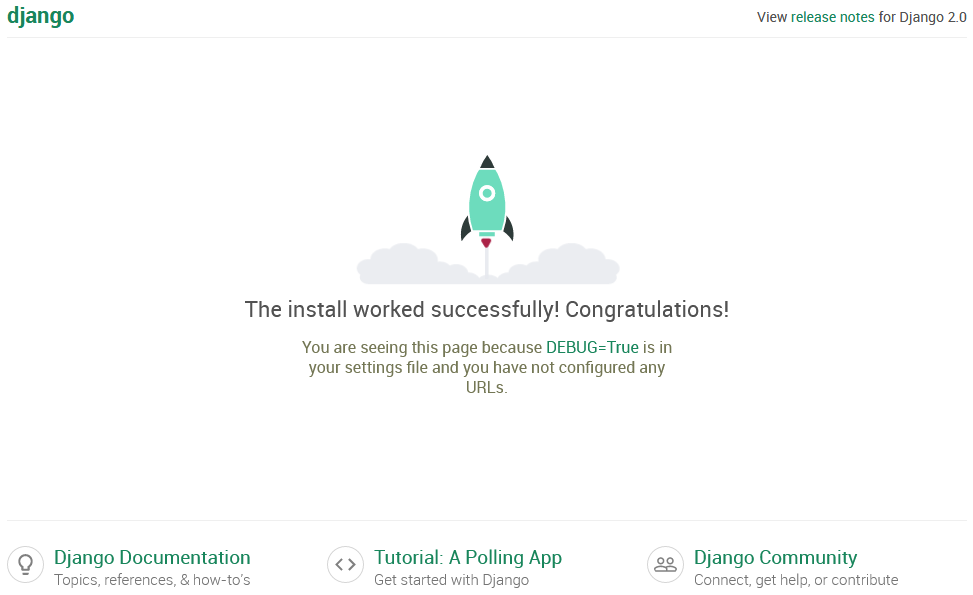
And you should see a webpage similar to the one below if you go to “localhost:8000” in your browser:
Create a new Django app
GeoDjango is a module included with Django that adds support to Geospatial data. One important feature of the GeoDjango module we will need in this tutorial are geospatial fields in Django models. However, GeoDjango needs to be enabled first in our project by adding it to the list of installed apps in “world/settings.py”:
Next, we create a single app in our project. We’ve called this app “cities” since it will represent the list of cities we will copy from the vector file to the database later:
And add this app the list of apps in “world/settings.py”, as we did for GeoDjango:
In this app, we create a model which represents an abstraction of the database table, by adding the code below to “cities/models.py”. This model has two fields representing the name and the coordinates of the cities respectively. The meta class modifies the formatting in the Django admin backend by telling it to sort the cities by name and to set the plural of the word ‘city’ to “cities” (not “citys” as we would get by default):
From this model a database table can generated with the commands below. Note that the second command will also create Django’s admin module tables that will store the users credentials among others:
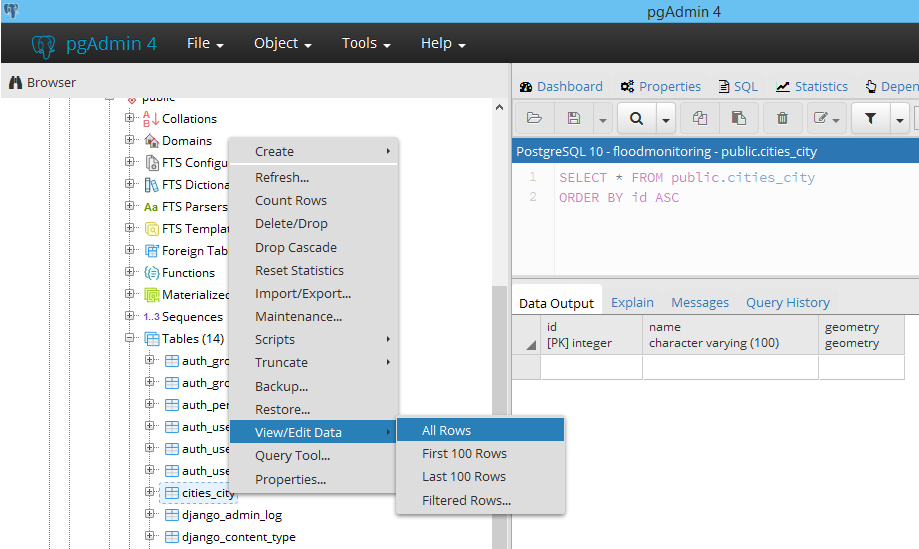
We can verify the creation of the database table with PgAdmin4.
Convert shapefile to PostGIS table
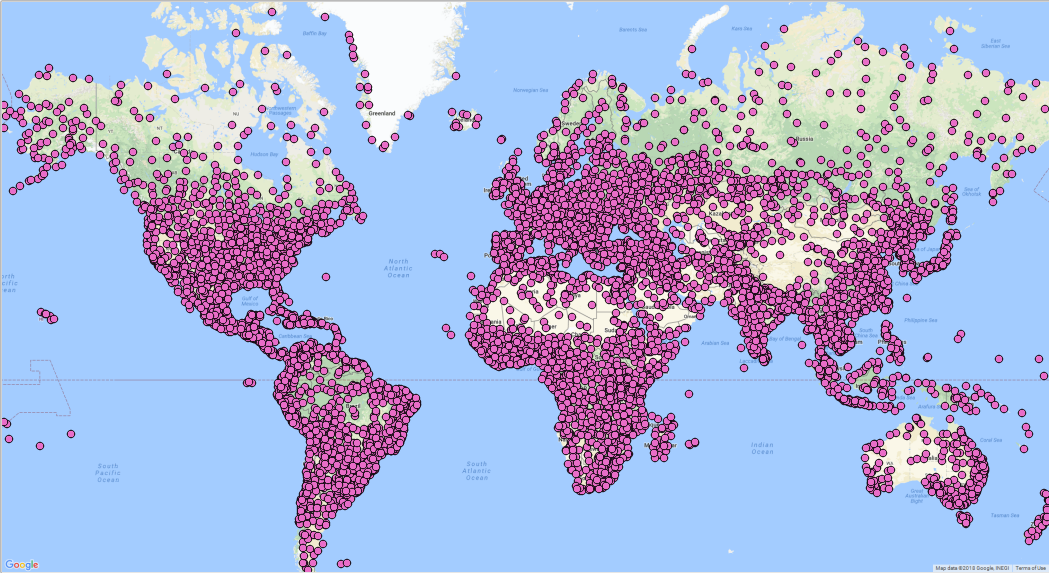
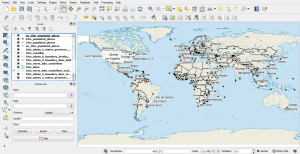
The vector shapefile of interest in this tutorial is a map of the world cities that can be also downloaded from this link. This shapefile can be opened and visualized with QGIS. This is what it should look like if it is superimposed on Google maps (over 7000 cities all over the world):
We will need to initially convert this vector shapefile to the PostGIS format of our database table (i.e. basically fill the table with the shapefile content), so we can access it later from the Django’s admin section (localhost:8000/admin) and from the front-end (localhost:8000/cities).
We must install the GDAL commands which if on Windows are included with QGIS. After installing QGIS the commands we will need can be found in the OSGeo4W Shell, which was installed with QGIS as well. On Arch Linux, this can be done differently by installing GDAL from the terminal:
On Windows, to avoid having a GDALException later regarding a missing EPSG csv file, we’re going to be proactive and add a system environment variable called “GDAL_DATA” having as a value: “C:\Program Files\QGIS 2.18\share\gdal”.
The conversion from the .shp format to the PostGIS table is carried out with a single command. Don’t forget to provide the database name, the database user and password, as well as the database table name that can be retrieved using the PostgreSQL GUI client, pgAdmin4. The -append option ensures that we’re adding to the existing table generated from the previous Django model, instead of creating the database table from scratch:
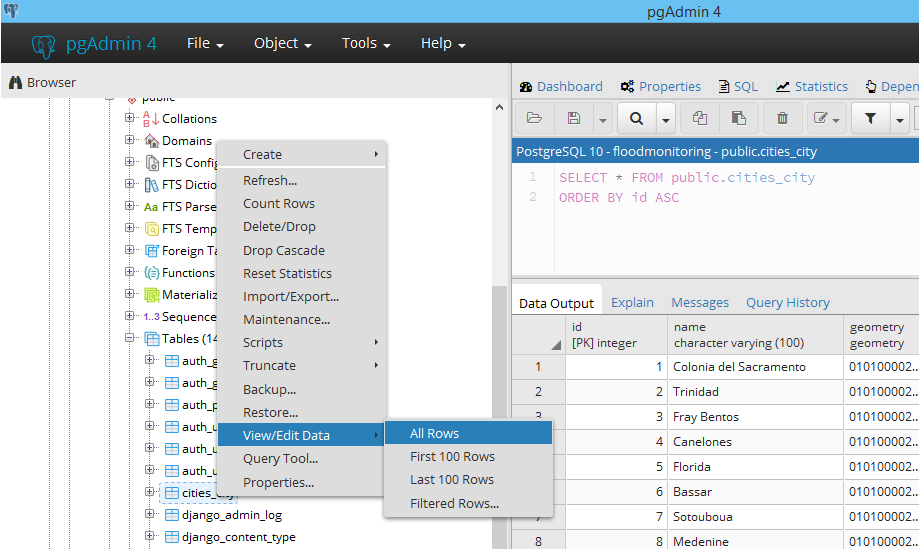
We can verify that the database table has been correctly filled with the cities names and geocoordinates in PgAdmin4:
Configure URL routes
Url routes have to be set-up so that the cities app can be accessed from the browser. We thus open “world/urls”, and add the url to the new app in the urlpatterns list:
All it does is to redirect any url that starts with “cities” to the urls file in the cities app. So what we have left to do is to create this file “cities/urls.py”:
Show cities on a map
In the following we’ll display on the browser the cities that we copied inside the database table. Django-leaflet is based on leaflet and is installed the same way as any python module. We’re going to make use of Django-leaflet to display maps on our Django web app:
This app needs to be registered among the list of installed apps in “world/settings.py”:
The url route added in the last part of the previous section forwards any request under the form “cities/<number>” to the CitiesDetailView class. This class is added to “cities/views.py”:
The generic class we’re inheriting from (django.views.generic.DetailView) already implements the detail view for a single city. We therefore just need to provide the template path and the model to render. The template for this detail page will be located in “templates/cities/city-detail.html”. Its content can be found below, where we followed the examples on Django-leaflet docs. The only part that deserves a small explanation is in the javascript block, where we’re putting a marker with leaflet at the coordinates of the city in question:
Now that both the view, the url route and the template have been configured if you browse to http://localhost:8000/cities/city/7223 for example, you should see a map of the city of San Francesco:
This tutorial has been relatively long. The next one in the series, which is actually the last one, will cover how to display maps on the Django admin page using Leaflet as always.
GEOS error on Windows
On Windows, when I browse to the url just created (e.g. localhost:8000/cities/city/1), Django started complaining about the GEOS library which couldn’t be found. To fix it, just open the settings.py and add at the end the path to this library (libgeos_c.dll), which is located inside the PostgreSQL folder:
You don’t have to pay a king’s ransom to map the world.
This is because you can do it all with free GIS software.
The best part is:
These free GIS software give you the firepower to get the job done as if you’re working with commercial GIS software.
We’ve mapped out the GIS software landscape , but these 13 (out of 30) reign supreme for free mapping software.
1 QGIS – Formerly Quantum GIS
Highlights: Community All-in-one Cartography Plugins GISGeography Favorite
After the epic GIS software battle in GIS history between ArcGIS vs QGIS, we illustrated with 27 differences why QGIS is undoubtedly the #1 free GIS software package.
QGIS is jam-packed with hidden gems at your fingertips. For example, you can automate map production, process geospatial data, and generate drool-worthy cartographic figures.
There’s no other free mapping software on this list that lets you map like a rock star than QGIS.
QGIS Plugins boost this mapping software into a state of epicness. If the tool doesn’t exist, search for a plugin developed by the QGIS community.
Volunteer effort is key to its success. The QGIS Stack Exchange support is impressively great.
If you’re still searching for free GIS software, you’d be insane not to download the free GIS software QGIS. Here’s your beginner’s guide to QGIS to get your feet wet.
In February 2018, QGIS 3 brings a whole new set of cartography, 3D and analysis tools. We’ve got you covered on how to find all of its newest features and plugins:
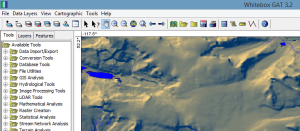
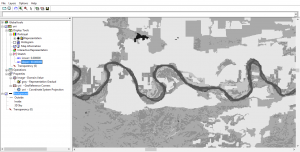
Yes, Whitebox GAT (Geospatial Analysis Toolbox) is #3 on the list of open source, free GIS software.
Unbelievably, Whitebox GAT has only been around since 2009 because it feels so fine-tuned when you see it in action.
There’s a hydrology theme around Whitebox GAT. It actually replaced Terrain Analysis System (TAS) – a tool for hydro-geomorphic applications.
Whitebox GAT is really a full-blown open-access GIS and remote sensing software package.
Where it shines is LIDAR!
With no barriers, Whitebox GAT is the swiss-army knife of LiDAR data.
The LiDAR toolbox is a life-saver. For example, LAS to shapefile is an insanely useful tool. But you may need a Java update to go in full throttle though.
The cartographic mapping software tools are primitive compared to QGIS.
But overall Whitebox GAT is solid with over 410 tools to clip, convert, analyze, manage, buffer and extract geospatial information.
I find it amazing this free GIS software almost goes unheard of in the GIS industry.
Highlights: Geoscientific Tools Ease of Use GISGeography Favorite
SAGA GIS (System for Automated Geoscientific Analyses) is one of the classics in the world of free GIS software.
It started out primarily for terrain analysis such as hillshading, watershed extraction and visibility analysis.
Now, SAGA GIS is a powerhouse because it delivers a fast growing set of geoscientific methods to the geoscientific community.
Enable multiple windows to lay out all your analysis (map, histograms, scatter plots, attributes, etc). It provides both a user-friendly GUI and API.
It’s not particularly useful in cartography but it’s a lifesaver in terrain analysis.
Closing gaps in raster data sets is easy. The morphometry tools are unique including the SAGA topographic wetness index and topographic position classification. If you have a DEM, and don’t know what to do with it – you NEED to look at SAGA GIS.
Overall, it’s quick, reliable and accurate. Consider SAGA GIS a prime choice for environmental modeling and other applications.
GRASS GIS (Geographic Resources Analysis Support System) was developed by the US Army Corps of Engineers as a tool for land management and environmental planning.
It has evolved into a free GIS software option for different areas of study.
Academia, environment consultants and government agencies (NASA, NOAA, USDA and USGS) use GRASS GIS because of its intuitive GUI and its reliability.
It has over 350 rock-solid vector and raster manipulation tools.
Not awfully useful in cartographic design, GRASS GIS excels primarily as a free GIS software option for analysis, image processing, digital terrain manipulation and statistics.
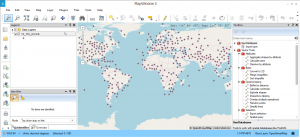
In 2000, MapWindow was proprietary GIS software. However, it has been made open through a contract with the US EPA called “Basins”. At this point, The source code was released to the public.
Now that MapWindow 5 has been released, it surprisingly has some serious punch. For example, MapWindow does about 90% of what GIS users need – map viewer, identify features, processing tools and print layout.
It has some higher level tools such as TauDEM for automatic watershed delineation. While HydroDesktop for data discovery, download, visualization and editing, DotSpatial for GIS programmers. In addition, it has an extensible plugin architecture for customization.
Free GIS software users rejoice. Once commercial GIS software, now turned into open source GIS. ILWIS (Integrated Land and Water Information Management) is an oldie but a goodie.
The extinction-proof ILWIS is free GIS software for planners, biologists, water managers and geospatial users. ILWIS is good at the basics – digitizing, editing, displaying geographic data. Further to this, it’s also used for remote sensing with tools for image classification, enhancements and spectral band manipulation.
Over time, it has improved support for time series, 3 analysis and animation. Overall, I found it difficult to do some of the basics like adding layers. However, the documentation is thorough with a pretty decent following for usage.
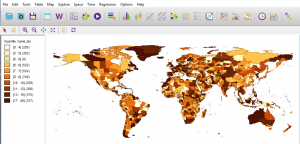
GeoDa is a free GIS software program primarily used to introduce new users into spatial data analysis. It’s main functionality is data exploration in statistics.
One of the nicest things about it is how it comes with sample data for you to give a test-drive. From simple box-plots all the way to regression statistics, GeoDa has complete arsenal of statistics to do nearly anything spatially.
It’s user base is strong. For example, Harvard, MIT and Cornell universities have embraced this free GIS software to serve as a gentle introduction to spatial analysis for non-GIS users. From economic development to health and real estate, it’s been used as an exciting analytical in labs as well.
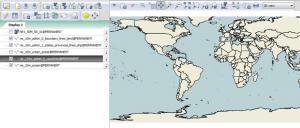
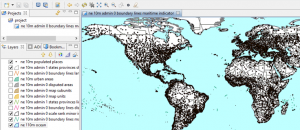
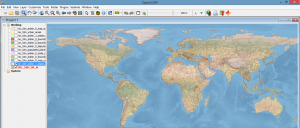
uDIG is an acronym to help get a better understanding what this Free GIS software is all about.
u stands for user-friendly interface
D stands for desktop (Windows, Mac or Linux). You can run uDIG on a Mac.
I stand for internet oriented consuming standard (WMS, WFS or WPS)
G stands for GIS-ready for complex analytical capabilities.
When you start digging into uDig, it’s a nice open source GIS software option for basic mapping.uDig’s Mapnik lets you import basemaps with the same tune as ArcGIS
Specifically, it’s easy-to-use, the catalog, symbology and Mac OS functionality are some of the strong points. But it has limited tools and the bugs bog it down to really utilize it as a truly complete free GIS software package.
10 OpenJump
Highlights: Open Source Conflation
Formerly JUMP GIS, OpenJump GIS (JAVA Unified Mapping Platform) started as a first class conflation project. It succeeded. But eventually grew into something much bigger. Because of how its large community effort grew, OpenJUMP into a more complete free GIS software package.
One of its strengths is how it handles large data sets well. Rendering is above-grade with a whole slew of mapping options. For example, you can generate pie charts, plotting and choropleth maps.
OpenJUMP GIS Plugins enhance its capabilities. There are plugins for editing, raster, printing, web-processing, spatial analysis, GPS and databases. Conflating data is another option with a whole lot more from its plugins.
Biologists using GIS unite! This one specializes in mapping biological richness and diversity distribution including DNA data.
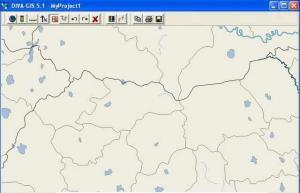
Diva GIS is another free GIS software package for mapping and analyzing data. Diva GIS also delivers useful, every day free GIS data for your mapping needs.
It’s possible to extract climate data for all locations on the land. From here, there are statistical analysis and modeling techniques to work with.
For the biologist in you, it’s worth a long look for biologists around the world. Otherwise, you should be looking at one of the top options above.
12 FalconView
Highlights: Open Source Fly-throughs
The initial purpose of FalconView is to be a free and open source GIS software.
Georgia Tech built this open software for displaying various types of maps and geographically referenced overlays.
Now, most of FalconView’s users are from the US Department of Defense and other National Geospatial Intelligence Agencies. This is because it can be used for combat flight planning.
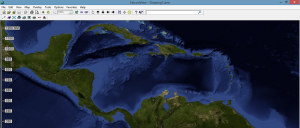
In SkyView mode, you can fly-through even using MXD files. It supports various types of display like elevation, satellite, LiDAR, KMZ and MrSID.
13 OrbisGIS
Highlights: Open Source
OrbisGIS is a work-in-progress. Its goal is to be a cross-platform open source GIS software package designed by and for research.
It provides some GIS techniques to manage and share spatial data. OrbisGIS is able to process vector and raster data models.
It can execute processes like noise maps or hydrology process without any add-ons. Orbis GIS Plug-ins are available but are very limited for the time-being.
The developers are still working on the documentation. You may want to look elsewhere until this project gets sturdy up on its feet.
Free GIS Software List
As we have shown, there’s a bucket load of free GIS software that can:
Perform hundreds of advanced GIS processing tasks.
Generate stunning cartography and mapping products.
Manage your company’s geospatial assets efficiently.
Now that you have a better vision of free GIS software available to you, did we miss anything?