Here
is a step-by-step tutorial on how to create a watershed delimitation based on a
Digital Elevation Model (DEM) using ArcGIS Desktop:
Step 1: Obtain DEM data
1.Download DEM data for your area of interest from a reliable source such as the USGS Earth Explorer or the National Elevation Dataset.
2.Import the DEM data into ArcGIS by opening the ArcMap application and selecting File > Add Data > Add Raster.
Step 2: Preprocessing the DEM data
1.Ensure that the DEM data is projected in a coordinate system suitable for the area of interest by checking the data properties under the Layer Properties > Source tab.
2.Fill any sinkholes in the DEM data using the Fill tool. This ensures that all water flows are accounted for in the analysis. To do this, go to Spatial Analyst Tools > Hydrology > Fill and set the input raster to your DEM data.
3.Generate a flow direction grid using the Flow Direction tool. This tool assigns a direction of steepest descent for each cell in the DEM. To do this, go to Spatial Analyst Tools > Hydrology > Flow Direction and set the input raster to the filled DEM data.
4.Generate a flow accumulation grid using the Flow Accumulation tool. This tool counts the number of cells that contribute to each cell in the DEM. To do this, go to Spatial Analyst Tools > Hydrology > Flow Accumulation and set the input raster to the flow direction grid.
Step 3: Create the watershed delimitation
1.Determine the pour point location for the desired watershed. This is the location where water flows out of the watershed. You can select this point manually or use another method to derive it from other data layers.
2.Create a raster of the pour point location by converting it to a raster using the Feature to Raster tool. This converts the point location to a cell with a value of 1 in the raster.
3.Generate a watershed grid using the Watershed tool. This tool creates a raster grid where each cell is assigned to the watershed that drains into the pour point location. To do this, go to Spatial Analyst Tools > Hydrology > Watershed and set the input flow direction raster to the flow direction grid, the input pour point raster to the pour point location raster, and the input flow accumulation raster to the flow accumulation grid.
Step 4: Refine the watershed boundary
1.Convert the watershed raster to a vector using the Raster to Polygon tool. This tool converts the raster cells to polygons that define the watershed boundary.
2.Clip the vector polygon to the desired boundary using the Clip tool. This tool removes any portions of the watershed that extend beyond the desired boundary.
Step 5: Display and analyze the results
1.Add the clipped watershed boundary to your ArcMap project and visualize it using the symbology and labeling tools.
2.Perform any further analysis on the watershed boundary as needed, such as calculating the area, length, and slope of the watershed, or overlaying other data layers such as land use or soil data.
That's it! By following these steps, you should be able to create a watershed delimitation based on a DEM using ArcGIS Desktop.
These steps could be also introduced in a ModelBuilder
Processing and using Lidar data with ArcGIS and QGIS can be a complex task, but here are the general steps to follow:
Acquire the Lidar data: The first step is to acquire the Lidar data. This can be done by downloading it from online sources or by purchasing it from a data provider.
Load the Lidar data into the software: The next step is to load the Lidar data into the software. In ArcGIS, you can use the “LAS Dataset To Raster” tool to convert the Lidar data into a raster format. In QGIS, you can use the “Import Raster” tool to load the Lidar data.
Pre-processing the Lidar data: Before using the Lidar data, you may need to perform some pre-processing tasks, such as filtering out noise, removing outliers, and adjusting the point density. In ArcGIS, you can use the “Classify LAS Noise” tool to filter out noise. In QGIS, you can use the “LAS Noise Removal” plugin.
Generating a Digital Elevation Model (DEM): Once the Lidar data has been pre-processed, you can generate a DEM from the data. In ArcGIS, you can use the “LAS Dataset To Raster” tool with the “Bare Earth” option to generate a DEM. In QGIS, you can use the “LAStools” plugin to generate a DEM.
Conducting terrain analysis: Once you have generated a DEM, you can conduct terrain analysis to extract information such as slope, aspect, and hillshade. In ArcGIS, you can use the “Surface Analysis” toolset to perform terrain analysis. In QGIS, you can use the “Terrain Analysis” plugin.
Creating 3D visualizations: Finally, you can use the Lidar data to create 3D visualizations, such as fly-through videos or 3D models. In ArcGIS, you can use the “3D Analyst” extension to create 3D visualizations. In QGIS, you can use the “Qgis2threejs” plugin.
These are the basic steps to process and use Lidar data with ArcGIS and QGIS. However, the specific tools and workflows may vary depending on the version of the software you are using and the specific Lidar data you are working with.
I am trying to run the Zonal Statistics as Table tool on my data in order to sum the number of cells of a certain type of landcover in each county. For example, I want it to sum how many Deciduous forest, Pasture/Hay land and etc.. there are in each county individually.
I have tried two different ways: 1. By using the Extract by Attributes tool on the raster to extract each individual type of cell (so, one raster is created for deciduous forest cells and one raster for paster/hay and etc...), then running the zonal statistic on each of those one at a time (not sure if this is necessary or not). 2. By just running the Zonal statistics as Table tool on the full raster.
I have tried EVERYTHING (saving it in a personal geodatabase, saving it in a file, getting rid of spaces in file names, making sure zone feature name is less than 17 characters etc...) and I still keep getting either "ERROR 999999" or there is no error at all under messages or even an indication that it has stopped, instead the red X circle just appears next to
it with no message. I attached a screenshot of what that second occurrence looks like.
Does anyone have any idea what I might be able to do to make this tool work? And do I need to be performing the "Extract by Attributes" tool or should the Zonal Statistics tool be able to sum up each type of cell (e.i. deciduous forest, developed land etc..) individually in each county?
Answer:
there appear to have spaces in the file names and (Tiger....)
what is the field with the period in it? it suggests a join on the table (not good)
input value raster (no file extension... what is it? not an esri grid for sure
Z folder... is that a network drive? a remapped drive? not a usb or some other non-local drive
Did you try a small sample of the data (split some pieces out to rule out memory issues)
Converting a polygon to a raster is going to show this behaviour if you zoom in close enough, and as Xander points out, you can gain control over the cell size of the conversion by doing the conversion prior to performing any further analysis. Processing Environments should always be considered and set before doing any sort of analysis. Unfortunately the 'Environments' button is way at the bottom right of all the tools in Arctoolbox in the region 'obscurata'... at least in ArcGIS Pro.. Environments is placed on an equal footing on the top of all tool dialog. Never assume... especially when working with rasters... by default the cell size is 1/250th the largest of the extent (width or height)... but what if you want a cell size of 10 m? isn't going to happen unless you set it before doing your work.
Meaning of Zonal Statistics Arcgis 10 Error?
Zonal Statistics Arcgis 10 Error is the error name that contains the details of the error, including why it occurred, which system component or application malfunctioned to cause this error along with some other information. The numerical code in the error name contains data that can be deciphered by the manufacturer of the component or application that malfunctioned. The error using this code may occur in many different locations within the system, so even though it carries some details in its name, it is still difficult for a user to pinpoint and fix the error cause without specific technical knowledge or appropriate software.
Causes of Zonal Statistics Arcgis 10 Error
If you have received this error on your PC, it means that there was a malfunction in your system operation. Common reasons include incorrect or failed installation or uninstallation of software that may have left invalid entries in your Windows registry, consequences of a virus or malware attack, improper system shutdown due to a power failure or another factor, someone with little technical knowledge accidentally deleting a necessary system file or registry entry, as well as a number of other causes. The immediate cause of the "Zonal Statistics Arcgis 10 Error" error is a failure to correctly run one of its normal operations by a system or application component.
How to fix Zonal Statistics Arcgis 10 Error
Follow these steps to fix your problem:
It is highly suggested that you carry out all the steps in exact manner to effectively get rid of your problem.
Scan the Computer with the Windows Repair Tool
This repair tool is free to download as well as easy to use. It scans, detects and repairs your computer for system errors like Zonal Statistics Arcgis 10 Error. The tool is powerful enough to find malicious items that are hidden on the computer.
1. Download Repair Tool from the link below. Save the file to your Desktop so that we can access the file easily. Repair Tool Download Link (right-click and save to your Desktop)
2. After downloading, navigate to the file location and double-click it. This will start the installation procedure. User Account Control will prompt if you want to run the program, click Yes to continue.
3. On initial launch of the program, it will display a welcome screen. Leave the checkbox unticked to allow the repair tool to start an automatic scan and click Install to start the installation procedure.
4. The tool will now install itself on your computer. The tool will download necessary updates so Internet connection is required at this point.
5. The tool will automatically start a preliminary scan of your machine to help determine the health of your PC.
6. Once the scan is complete the tool will tell you which areas of your PC are damaged and if a repair is necessary. If it is, click on the Start Repair button in the bottom right corner.
7. After it's finished it's repair your computer should be fixed. You may need to restart your computer to complete the process.
How does it work?
This tool will scan and diagnose, then repairs, your PC with patent pending technology that fix your windows operating system registry structure. basic features: (repairs system freezing and rebooting issues , start-up customization , browser helper object management , program removal management , live updates , windows structure repair.)
You don’t have to pay a king’s ransom to map the world.
This is because you can do it all with free GIS software.
The best part is:
These free GIS software give you the firepower to get the job done as if you’re working with commercial GIS software.
We’ve mapped out the GIS software landscape , but these 13 (out of 30) reign supreme for free mapping software.
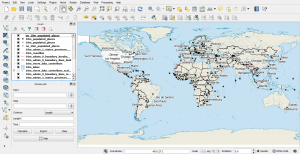
1 QGIS – Formerly Quantum GIS
Highlights: Community All-in-one Cartography Plugins GISGeography Favorite
After the epic GIS software battle in GIS history between ArcGIS vs QGIS, we illustrated with 27 differences why QGIS is undoubtedly the #1 free GIS software package.
QGIS is jam-packed with hidden gems at your fingertips. For example, you can automate map production, process geospatial data, and generate drool-worthy cartographic figures.
There’s no other free mapping software on this list that lets you map like a rock star than QGIS.
QGIS Plugins boost this mapping software into a state of epicness. If the tool doesn’t exist, search for a plugin developed by the QGIS community.
Volunteer effort is key to its success. The QGIS Stack Exchange support is impressively great.
If you’re still searching for free GIS software, you’d be insane not to download the free GIS software QGIS. Here’s your beginner’s guide to QGIS to get your feet wet.
In February 2018, QGIS 3 brings a whole new set of cartography, 3D and analysis tools. We’ve got you covered on how to find all of its newest features and plugins:
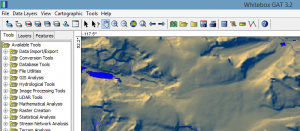
Yes, Whitebox GAT (Geospatial Analysis Toolbox) is #3 on the list of open source, free GIS software.
Unbelievably, Whitebox GAT has only been around since 2009 because it feels so fine-tuned when you see it in action.
There’s a hydrology theme around Whitebox GAT. It actually replaced Terrain Analysis System (TAS) – a tool for hydro-geomorphic applications.
Whitebox GAT is really a full-blown open-access GIS and remote sensing software package.
Where it shines is LIDAR!
With no barriers, Whitebox GAT is the swiss-army knife of LiDAR data.
The LiDAR toolbox is a life-saver. For example, LAS to shapefile is an insanely useful tool. But you may need a Java update to go in full throttle though.
The cartographic mapping software tools are primitive compared to QGIS.
But overall Whitebox GAT is solid with over 410 tools to clip, convert, analyze, manage, buffer and extract geospatial information.
I find it amazing this free GIS software almost goes unheard of in the GIS industry.
Highlights: Geoscientific Tools Ease of Use GISGeography Favorite
SAGA GIS (System for Automated Geoscientific Analyses) is one of the classics in the world of free GIS software.
It started out primarily for terrain analysis such as hillshading, watershed extraction and visibility analysis.
Now, SAGA GIS is a powerhouse because it delivers a fast growing set of geoscientific methods to the geoscientific community.
Enable multiple windows to lay out all your analysis (map, histograms, scatter plots, attributes, etc). It provides both a user-friendly GUI and API.
It’s not particularly useful in cartography but it’s a lifesaver in terrain analysis.
Closing gaps in raster data sets is easy. The morphometry tools are unique including the SAGA topographic wetness index and topographic position classification. If you have a DEM, and don’t know what to do with it – you NEED to look at SAGA GIS.
Overall, it’s quick, reliable and accurate. Consider SAGA GIS a prime choice for environmental modeling and other applications.
GRASS GIS (Geographic Resources Analysis Support System) was developed by the US Army Corps of Engineers as a tool for land management and environmental planning.
It has evolved into a free GIS software option for different areas of study.
Academia, environment consultants and government agencies (NASA, NOAA, USDA and USGS) use GRASS GIS because of its intuitive GUI and its reliability.
It has over 350 rock-solid vector and raster manipulation tools.
Not awfully useful in cartographic design, GRASS GIS excels primarily as a free GIS software option for analysis, image processing, digital terrain manipulation and statistics.
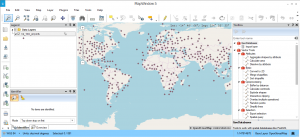
In 2000, MapWindow was proprietary GIS software. However, it has been made open through a contract with the US EPA called “Basins”. At this point, The source code was released to the public.
Now that MapWindow 5 has been released, it surprisingly has some serious punch. For example, MapWindow does about 90% of what GIS users need – map viewer, identify features, processing tools and print layout.
It has some higher level tools such as TauDEM for automatic watershed delineation. While HydroDesktop for data discovery, download, visualization and editing, DotSpatial for GIS programmers. In addition, it has an extensible plugin architecture for customization.
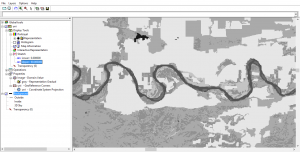
Free GIS software users rejoice. Once commercial GIS software, now turned into open source GIS. ILWIS (Integrated Land and Water Information Management) is an oldie but a goodie.
The extinction-proof ILWIS is free GIS software for planners, biologists, water managers and geospatial users. ILWIS is good at the basics – digitizing, editing, displaying geographic data. Further to this, it’s also used for remote sensing with tools for image classification, enhancements and spectral band manipulation.
Over time, it has improved support for time series, 3 analysis and animation. Overall, I found it difficult to do some of the basics like adding layers. However, the documentation is thorough with a pretty decent following for usage.
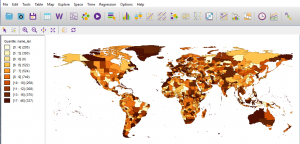
GeoDa is a free GIS software program primarily used to introduce new users into spatial data analysis. It’s main functionality is data exploration in statistics.
One of the nicest things about it is how it comes with sample data for you to give a test-drive. From simple box-plots all the way to regression statistics, GeoDa has complete arsenal of statistics to do nearly anything spatially.
It’s user base is strong. For example, Harvard, MIT and Cornell universities have embraced this free GIS software to serve as a gentle introduction to spatial analysis for non-GIS users. From economic development to health and real estate, it’s been used as an exciting analytical in labs as well.
uDIG is an acronym to help get a better understanding what this Free GIS software is all about.
u stands for user-friendly interface
D stands for desktop (Windows, Mac or Linux). You can run uDIG on a Mac.
I stand for internet oriented consuming standard (WMS, WFS or WPS)
G stands for GIS-ready for complex analytical capabilities.
When you start digging into uDig, it’s a nice open source GIS software option for basic mapping.uDig’s Mapnik lets you import basemaps with the same tune as ArcGIS
Specifically, it’s easy-to-use, the catalog, symbology and Mac OS functionality are some of the strong points. But it has limited tools and the bugs bog it down to really utilize it as a truly complete free GIS software package.
10 OpenJump
Highlights: Open Source Conflation
Formerly JUMP GIS, OpenJump GIS (JAVA Unified Mapping Platform) started as a first class conflation project. It succeeded. But eventually grew into something much bigger. Because of how its large community effort grew, OpenJUMP into a more complete free GIS software package.
One of its strengths is how it handles large data sets well. Rendering is above-grade with a whole slew of mapping options. For example, you can generate pie charts, plotting and choropleth maps.
OpenJUMP GIS Plugins enhance its capabilities. There are plugins for editing, raster, printing, web-processing, spatial analysis, GPS and databases. Conflating data is another option with a whole lot more from its plugins.
Biologists using GIS unite! This one specializes in mapping biological richness and diversity distribution including DNA data.
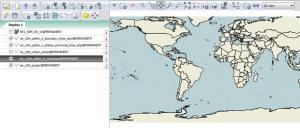
Diva GIS is another free GIS software package for mapping and analyzing data. Diva GIS also delivers useful, every day free GIS data for your mapping needs.
It’s possible to extract climate data for all locations on the land. From here, there are statistical analysis and modeling techniques to work with.
For the biologist in you, it’s worth a long look for biologists around the world. Otherwise, you should be looking at one of the top options above.
12 FalconView
Highlights: Open Source Fly-throughs
The initial purpose of FalconView is to be a free and open source GIS software.
Georgia Tech built this open software for displaying various types of maps and geographically referenced overlays.
Now, most of FalconView’s users are from the US Department of Defense and other National Geospatial Intelligence Agencies. This is because it can be used for combat flight planning.
In SkyView mode, you can fly-through even using MXD files. It supports various types of display like elevation, satellite, LiDAR, KMZ and MrSID.
13 OrbisGIS
Highlights: Open Source
OrbisGIS is a work-in-progress. Its goal is to be a cross-platform open source GIS software package designed by and for research.
It provides some GIS techniques to manage and share spatial data. OrbisGIS is able to process vector and raster data models.
It can execute processes like noise maps or hydrology process without any add-ons. Orbis GIS Plug-ins are available but are very limited for the time-being.
The developers are still working on the documentation. You may want to look elsewhere until this project gets sturdy up on its feet.
Free GIS Software List
As we have shown, there’s a bucket load of free GIS software that can:
Perform hundreds of advanced GIS processing tasks.
Generate stunning cartography and mapping products.
Manage your company’s geospatial assets efficiently.
Now that you have a better vision of free GIS software available to you, did we miss anything?